Tektronix MDO4104-6 Spectrogram

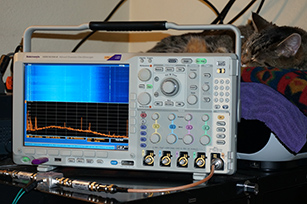
Tektronix MDO4104-6 Mixed Domain Oscilloscope spectrum analyzer setup for monitoring the solar radio emissions and Jupiter decametric radio emission from 17.5 MHz to 24 MHz.
- Frequency settings
- 17.5 MHz start frequency
- 20.75 MHz center frequency
- 24 MHz stop frequency
- 6.5 MHz frequency span
- 650 kHz per horizontal division
- 6.5 MHz capture bandwidth
- MDO4104-6 is a DFT type of spectrum analyzer which shows all the signals in the capture bandwidth at the same time.
- 100 Hz resolution bandwidth
- -25 dBm reference level
- 5 dBm per vertical division
- The top blue window is the spectrogram
- The bottom black widow is the spectrum analyzer trace of the current acquisition.
- Spectrogram bottom is the current spectrum trace shown at the bottom of the display.
- ~7 seconds spectrum update rate
- Spectrogram top is the oldest spectrum, approximately 30 minutes after the current spectrum trace at the bottom.
- Spectrogram signal intensity is represented by colors
- Dark blue: low signal amplitude
- White blue: medium signal amplitude
- Red: high signal amplitude
- Date and time in lower right corner is in UT.
- local time PST, USA (UT -8 hours)
- local time PDT, USA (UT -7 hours)

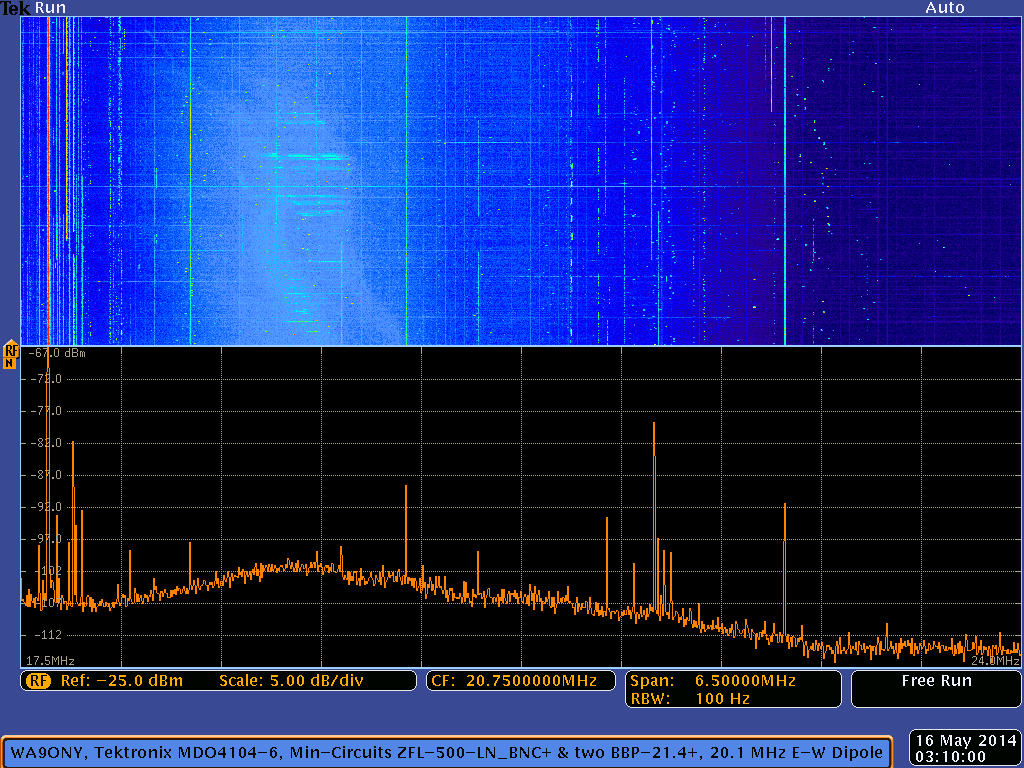
Spectrogram at May 16, 2014 at 03:10:00 UT.
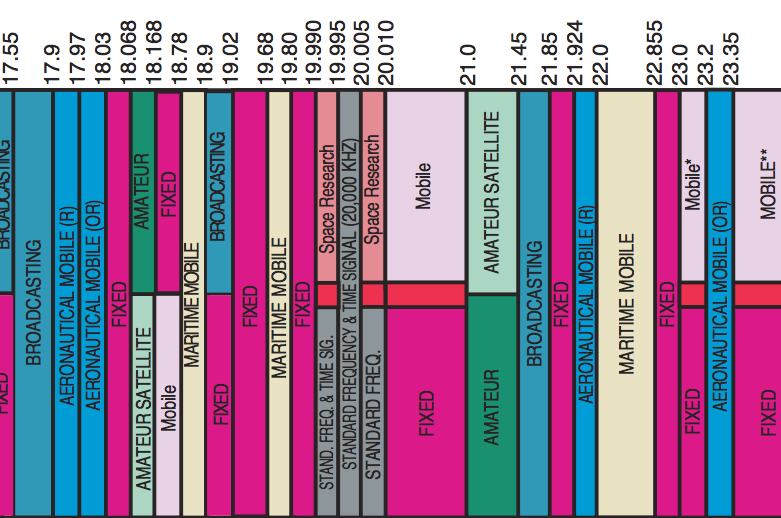
- The first set of strong vertical signals from the left edge are the 17.5 MHz to 17.9 MHz broadcasting stations.
- The strongest broadcast radio stations are solid vertical lines in the spectrogram.
- The second set of strong signals from the left edge are the
17 meter (18.068 MHz to 18.168 MHz) amateur radio band.
- Amateur radio signals are short transmissions and look like dots or vertical dashes in the spectrogram.
- Radio station WWV at 20.0 MHz
is the blue vertical line (with a few gaps in the line) in the spectrogram just over one division left of center.
- WWV distance is 1,511 km with a bearing of 105.3 degrees.
- The strong set of signals just right of the center frequency is the
15 meter
(21.0 MHz to 21.45 MHz) amateur radio band.
- The other faint horizontal lines in the spectrogram are lighting or RFI bursts.
- The antenna sensitivity peaks on the left side of the spectrogram.
- This results in the background noise being a lighter blue color and it is the vertical broad white-blue band on the left side of the spectrogram.
- Sunset on May 15, 2014 was 19:16 PDT, (03:16 UT on May 16, 2014)
- Observing Location : Camas, WA USA, 16.6 miles East-North-East from the center of Portland, OR, USA
- Camas (Longitude: West 122.68 degrees & Latitude: North 45.52 degrees)
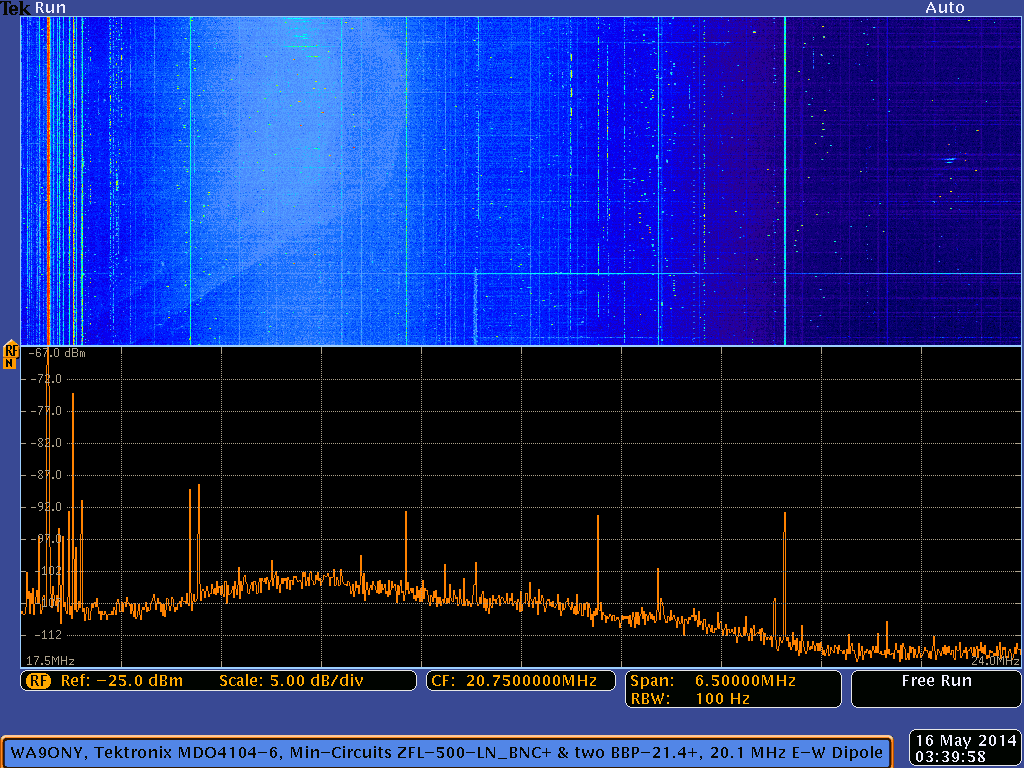
Spectrogram at May 16, 2014 at 03:39:58 UT.
- In the below spectrogram (03:10:00 UT) the top of the spectrogram is the same as the above spectrogram (03:39:58 UT).

United States Frequency Allocations


© 1998-2014 David Haworth
![]()

![]()


