|
- Sudden Ionospheric Disturbance (SID)
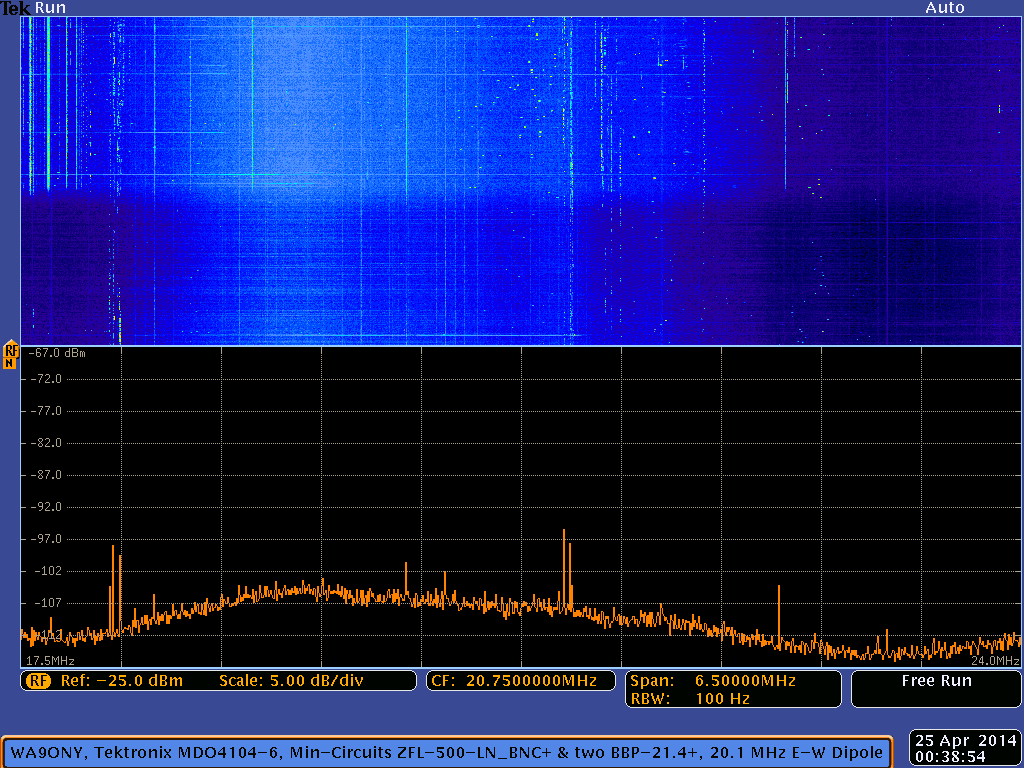
- Below is the Tektronix MDO4104-6 spectrum analyzer display showing the SID from 17.5 MHz to 24.0 MHz at 0038 UT.
- The X-ray flare ionized the lower layers of the earth's ionosphere causing an
increase in absorption of terrestrial radio signals.
- Notice the change in signals in the top half of the spectrogram and the radio blackout in the bottom half of the spectrogram.
- The radio blackout shown in the spectrogram is greater than 15 minutes long.
- Spectrogram
- The spectrum analyzer spectrogram is the blue display (the top window)
- The spectrogram horizontal axes is from 17.5 MHz to 24 MHz.
- The top blue display vertical axis is time with the oldest time is at the top.
- The black bottom display is the latest spectrum trace at 00:38:54 UT.
- The vertical white lines are radio signals that are being received.
- The faint very thin vertical lines are local radio frequency interference (RFI) which is not affected by the change in the ionosphere.
- The white vertical dots are short duration radio signals.
- Many of the vertical white lines stopped at the time of the X-ray flare in the middle of the spectrogram.
- Also, there is a decrease of overall background radio noise (white blueish color) during the blackout.
- Radio Bands
- The first set of strong signals from the left edge is the 17.5 MHz to 17.9 MHz broadcasting band.
- The second set of strong signals from the left edge is the
17 meter (18.068 MHz to 18.168 MHz) amateur radio band.
- Radio station WWV at 20.0 MHz
is the blue vertical line in the spectrogram just over one division left of center.
- WWV is 1,511 km with a bearing of 105.3 degrees.
- The strong set of signals just right of the center frequency is the
15 meter
(21.0 MHz to 21.45 MHz) amateur radio band.

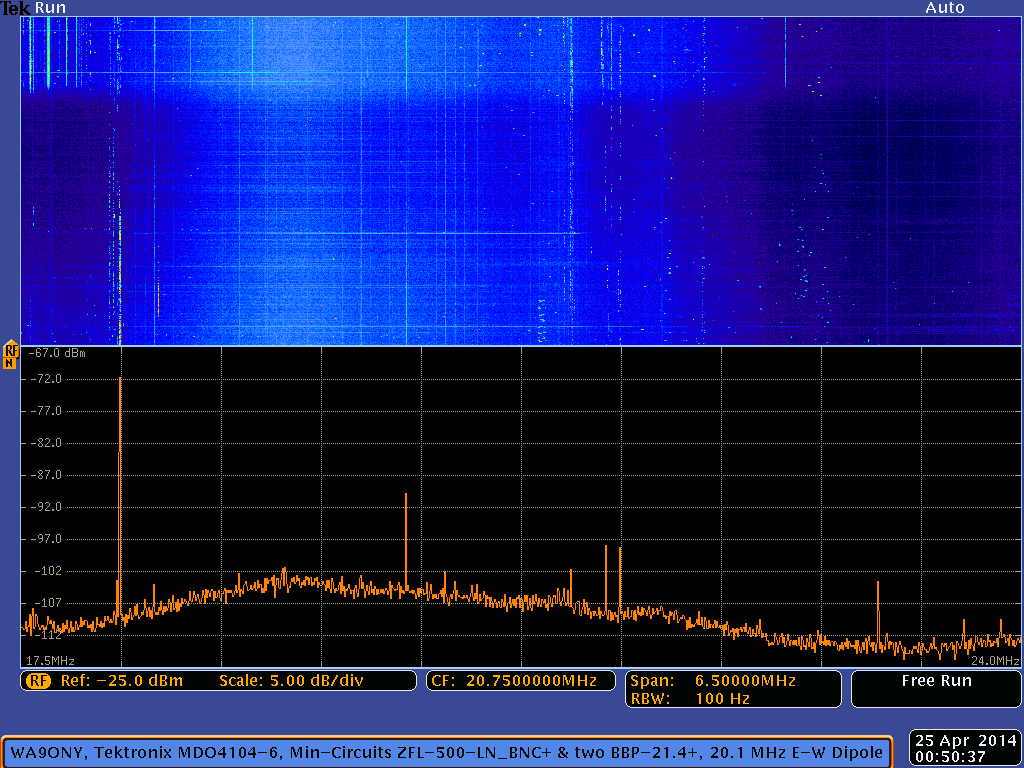
- Below is the Tektronix MDO4104-6 spectrum analyzer display showing the SID from approximately 20.1 MHz to 24.0 MHz at 0050 UT.
- Radio station WWV at 20.0 MHz
is the blue vertical line in the spectrogram just over one division left of center.

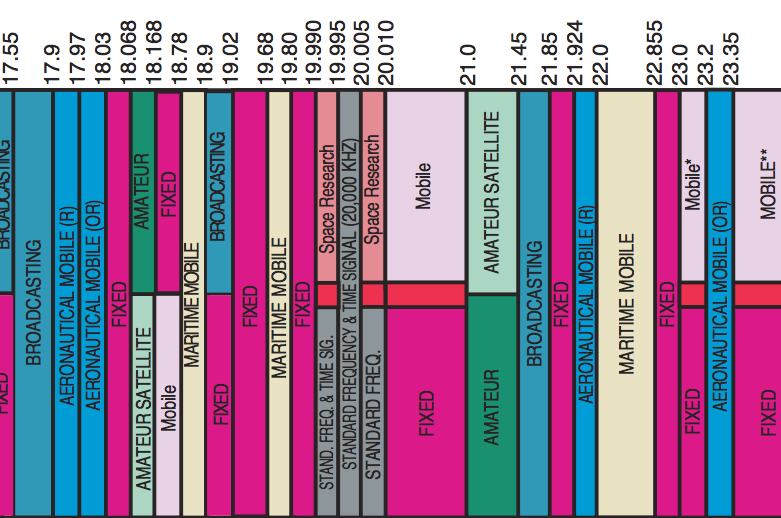
United States Frequency Allocations

Summary
Tektronix MDO4104-6 spectrum analyzer.
- 17.5 MHz start frequency
- 20.75 MHz center frequency
- 24.0 MHz stop frequency
- 6.5 MHz frequency span
- 6.5 MHz capture bandwidth
- 100 Hz resolution bandwidth
- 650 kHz per horizontal division
- 5 dBm per vertical division
- ~7 seconds spectrum update rate
- Spectrogram bottom is the current spectrum trace shown at the bottom of the display.
- Spectrogram top is the oldest spectrum, approximately 30 minutes after the current spectrum trace at the bottom.
|

Observing Information
- OBS-Location: Camas, WA USA, 16.6 miles East-North-East from the center of Portland, OR, USA

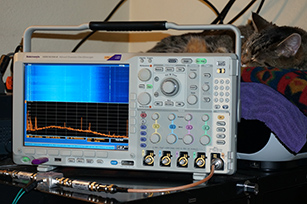
Spectrum Analyzer Equipment

Software

Radio JOVE Data Archive Calendar

Verifying SID Caused by X-Flare
NOAA/ National Weather Service
National Centers for Environmental Prediction
Space Weather Prediction Center
Solar Event Reports (Edited Events)
- Solar X-flare began at 0017 UT and ended at 00383 UT
- Reporting observatory G15: GOES spacecraft for the observatory
- Event XRA: X-ray event from SWPC's Primary or Secondary GOES spacecraft
- Particulars:
Intensity X1.3
Product: 20140425events.txt
:Created: 2014 Apr 26 2102 UT
:Date: 2014 04 25
# Prepared by the U.S. Dept. of Commerce, NOAA, Space Weather Prediction Center
# Please send comments and suggestions to SWPC.Webmaster@noaa.gov
#
# Missing data: ////
# Updated every 30 minutes.
#                            Edited Events for 2014 Apr 25
#
#Event    Begin    Max       End  Obs  Q  Type  Loc/Frq   Particulars       Reg#
#-------------------------------------------------------------------------------

4870       0017   0027      0038  G15  5   XRA  1-8A      X1.3    1.1E-01   2035
|

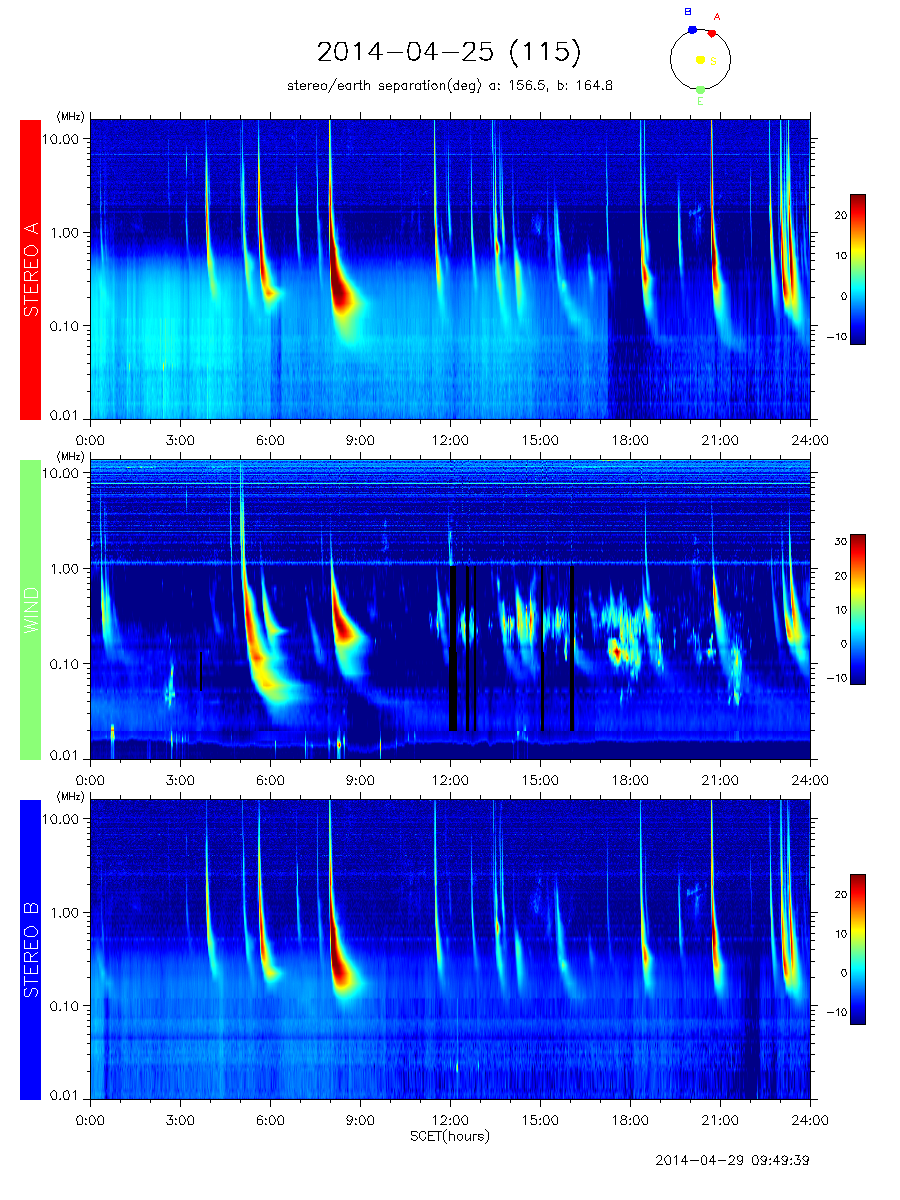
NASA STEREO / WAVES
NASA WIND-WAVES: The Radio and Plasma Wave Investigation on the WIND Spacecraft
NASA STEREO (Solar TErrestrial RElations Observatory)
NASA STEREO / WAVES data


|
![]()
![]()

