PHYS508 Night Sky Institute
Spectroscopy Session
August 1-5, 2011
Spectral analysis
is a technique to learn about the composition of celestrial objects and the
radial velocity of celestrial objects.
The following videos, simulators, labs, PDFs, posters and web pages provide a background for the
night time imaging spectroscopy projects at the
Woodburn STEM Partnership
PHYS508 Night Sky Institute Workshop
at the
Pine Mountain Observatory (PMO)
and at the High Desert Middle School in Bend, Oregon, USA.

Monday
night imaging with the
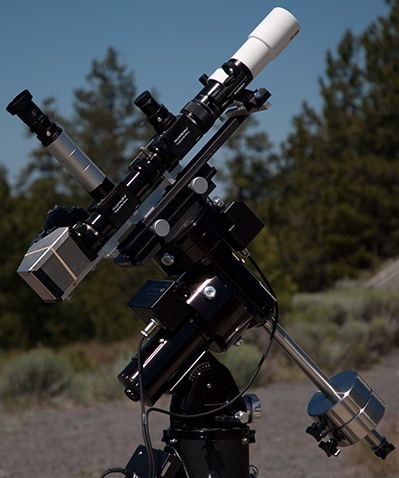
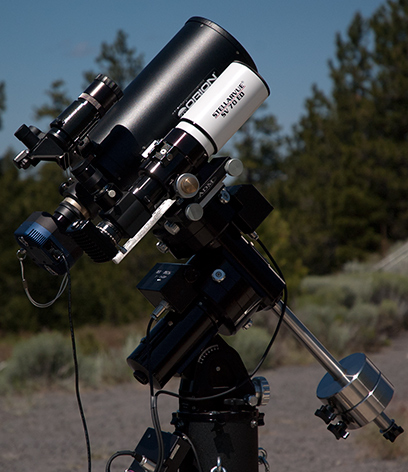
Borg 60mmED, 1200lines/mm spectrograph
on August 1, 2011
- Sky (solar) spectrum
- Jupiter spectrum
- Mirach M0 III spectrum
- Ring planetary nebula M57 and two stars spectrum with slit very wide open. The sky glow from Bend, OR is the vertical green band.
- Dumbell planetary nebula M27 spectrum with slit very wide open. The sky glow from Bend, OR is the vertical green band.

Tuesday Afternoon August 2, 2011
Learing objectives
- Identify continuous, absorption & emission spectra
- Build a solar spectroscope
- Observer the Sun spectrum
- Identify H, Na and Mg elements in the Sun by their H-beta, Na doublet and Mg triplet absorption spectra
Spectrum lab with three types of lights
Observer solar Absorption lines lab


Tuesday night imaging with the
Rainbow Optics 200 lines/mm diffraction grating spectroscope
on August 2, 2011
- Star Vega spectrum imaging from 10:19 pm to 11:07 pm
- Planetary nebula M57 spectrum imaging from 11:46 pm to 12:02 am
- Quasar spectrum imaging from 12:19 am to 3:35 am

Wednesday August 3, 2011
Learing objectives
- Properties of light
- Principles of spectroscopes
- How to build a spectroscope
- Spectrum of light sources
Light and The Electromagnetic Spectrum
Emission, Absorption & Continuous Spectra
- Lakeview Museum Spectrum of the Stars Video (1 min.).
- Emission & absorption lines.
- Joachim Köppen Strasbourg/Illkirch/Kiel 2007 Spectra of Gas Discharges
- NAAP Three Views Spectrum Demonstrator
- CassiopeiaProject Spectral Lines Video (4 min.)
- Energy states.
- Energy of a photon.
- Absorption lines.
- Emission lines.
- Hydrogen absorption and emission lines.
- NIST Periodic Table of the Elements poster.
- kosasihiskandarsjah Spectroscope Video (3 min.).
- Spectroscope.
- Continuous spectrum.
- Absorption spectrum.
- Emission spectrum.
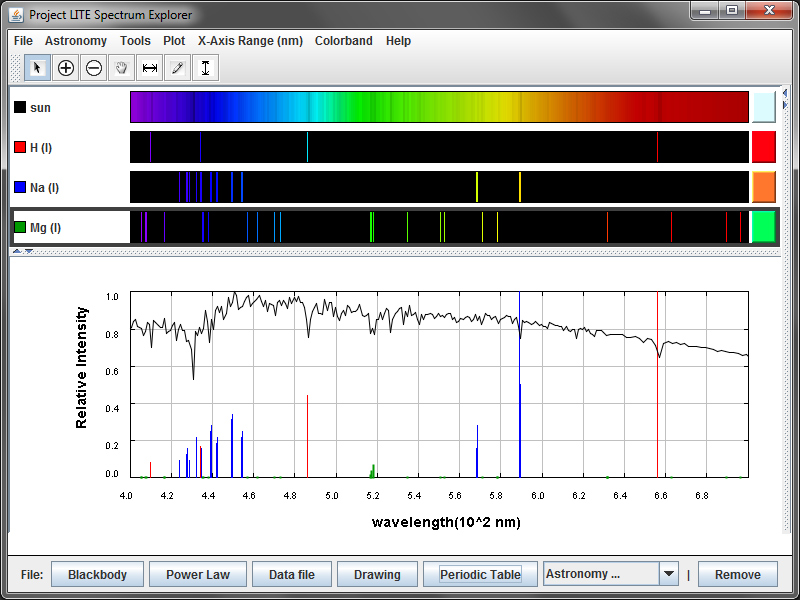
- Project LITE Spectrum Explorer
- Launch Spectrum Explorer (v. 3.0)
- Select Data File sun.dat
- Select X-Axis Range (nm) 400 to 700 (vis)
- Select Periodic Table H
- Select Periodic Table Na Select an ionization level 1
- Select Periodic Table Mg Select an ionization level 1
- Close the Periodic Table with the side arrow
- Below is a screen capture of Spectrum Explorer (v. 3.0) showing the visible spectrum of the Sun.


Wednesdaynight imaging with the
Rainbow Optics 200 lines/mm diffraction grating spectroscope
on August 3, 2011
- Star Vega Lry A0 V spectrum MaxIm DL screen capture
- Star 13 Lry M5 III spectrum MaxIm DL screen capture
- Star 12 Lry M4 II spectrum MaxIm DL screen capture
- Star Chi Cyg S6 spectrum MaxIm DL screen capture
- Star WR140 WC7 spectrum MaxIm DL screen capture
- Star WR136 WN6 spectrum MaxIm DL screen capture
- Star HD192445 Be spectrum MaxIm DL screen capture
- Planetary nebula NGC7662 spectrum MaxIm DL screen capture
- Planetary nebula NGC7009 spectrum MaxIm DL screen capture

Thursday Afternoon August 4, 2011
ImageJ spectrum analysis demonstartion

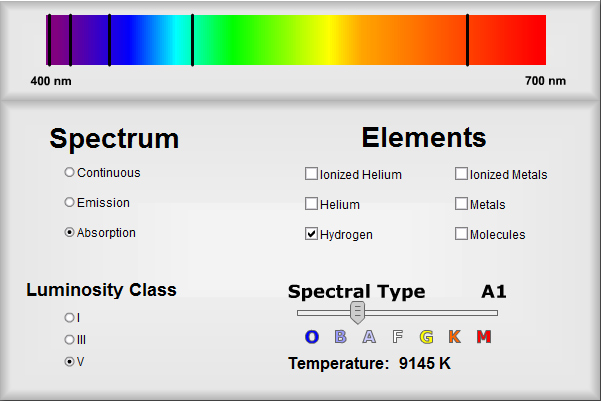
NAAP Spectrum Explorer demonstration
- Select Absorption Spectrum.
- Select Hydrogen Element.
- Select V Luminosity Class.
- Vary the Spectral Type and determine which Spectral Type has the maximum hydrogen absorption.
- To understand the changes refer to
Deriving chemical composition from spectra
by Michael Richmond.
Grating & Slit Lab
- PHYS142 Lab 11 Diffraction by loopcoop (First 5 min.)
- Diffraction Lab
- How does the lines/mm of a CD-ROM compare to a 500 lines/mm grating and a 1000 lines/mm grating?
- How does the lines/mm of a DVD-ROM compare to a 500 lines/mm grating and a 1000 lines/mm grating?
- Slit Lab
Spectroscope Lab
- Build a
Stanford Solar Center
spectroscope with a 1000 lines per mm grating
- Spectrum of different light sources
- Hydrogen spectrum (PDF) handout.
- Hydrogen gas tube spectrum lab.
- Neon and Mercury spectrums (PDF) handout.

Thursday night imaging with the
Borg 60mmED, 1200lines/mm spectrograph
on August 4, 2011


- PHYS508 Night Sky Institute Spectroscopy, August 1-5, 2011

The following test pattern is to help you adjust your monitor to best view the CCD astro images.
The test pattern is used for adjusting monitor brightness, and contrast.
Adjust monitor brightness and contrast to see all 16 gray scale levels.
The most important adjustment when viewing astro images is to see the differences in all of the black bands.

Web page version August 30, 2011

© 1998-2012 David Haworth
![]()
![]()


![]()